Back in 2016, I was obsessed with the idea of self-tracking. Not just fitness — everything. How does your mood depend on sleep? How does your fuel consumption change month to month? Are you actually doing more push-ups than last week, or does it just feel that way? Litemetrix (originally called EasyMeter) was my answer to that.
The concept
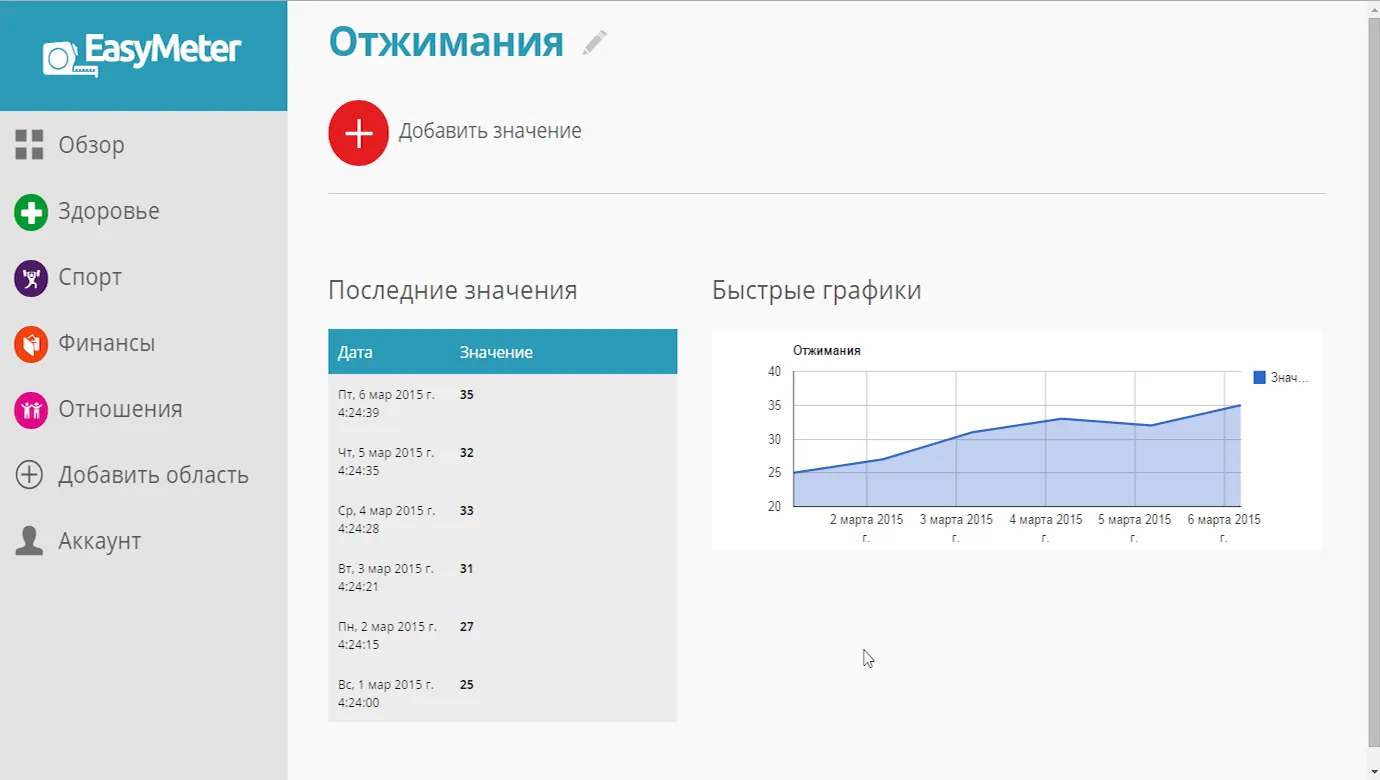
Think of it as Google Analytics, but for your daily life. You create custom metrics — anything you want to track — and log values over time. The app organizes them into categories: Health, Sport, Finances, Relationships, or whatever you come up with. Each metric gets a chart that shows your progress.
Flexible metrics
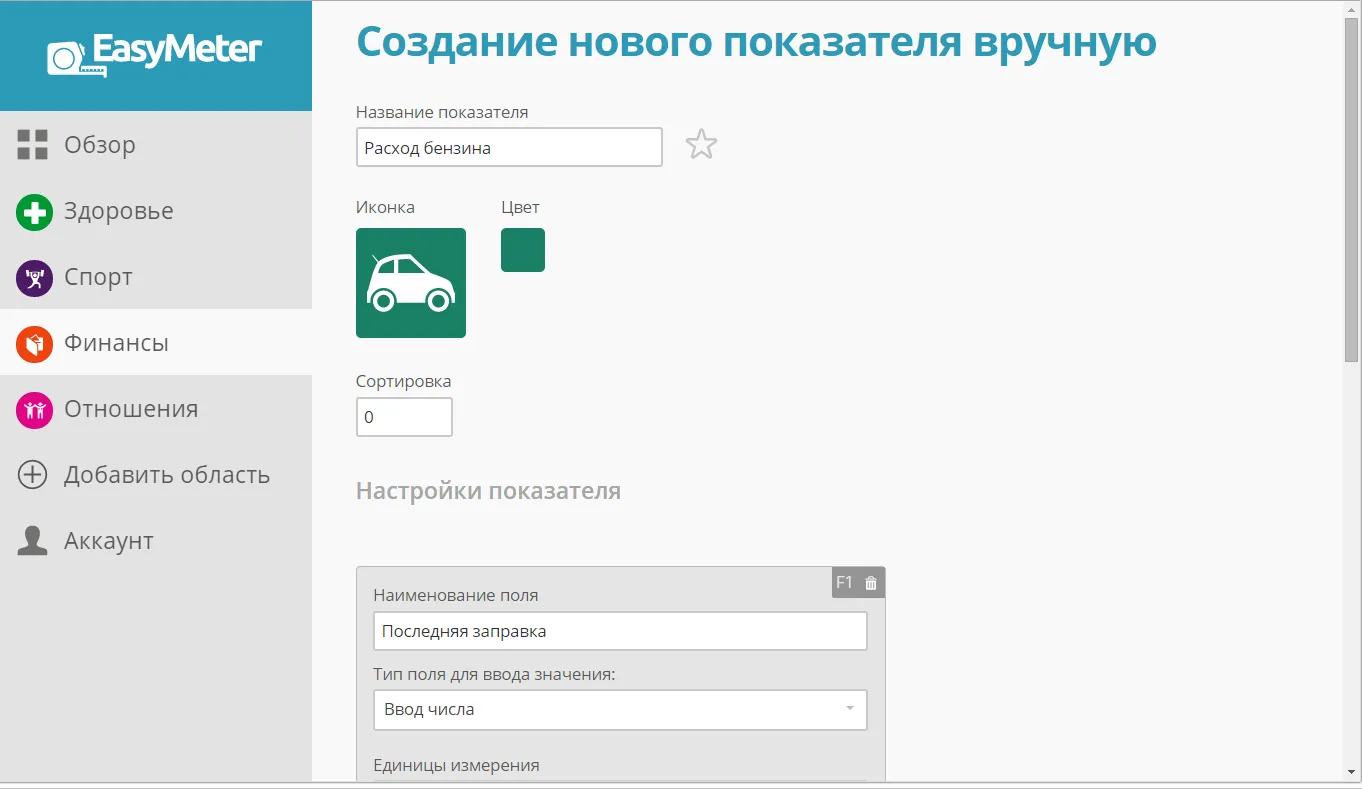
The cool part was that you could track literally anything. Push-ups, blood pressure, fuel expenses, rent payments, how many books you read this month. Each metric had a customizable type (number, checkbox, text), its own icon, color, and sorting order.
Categories
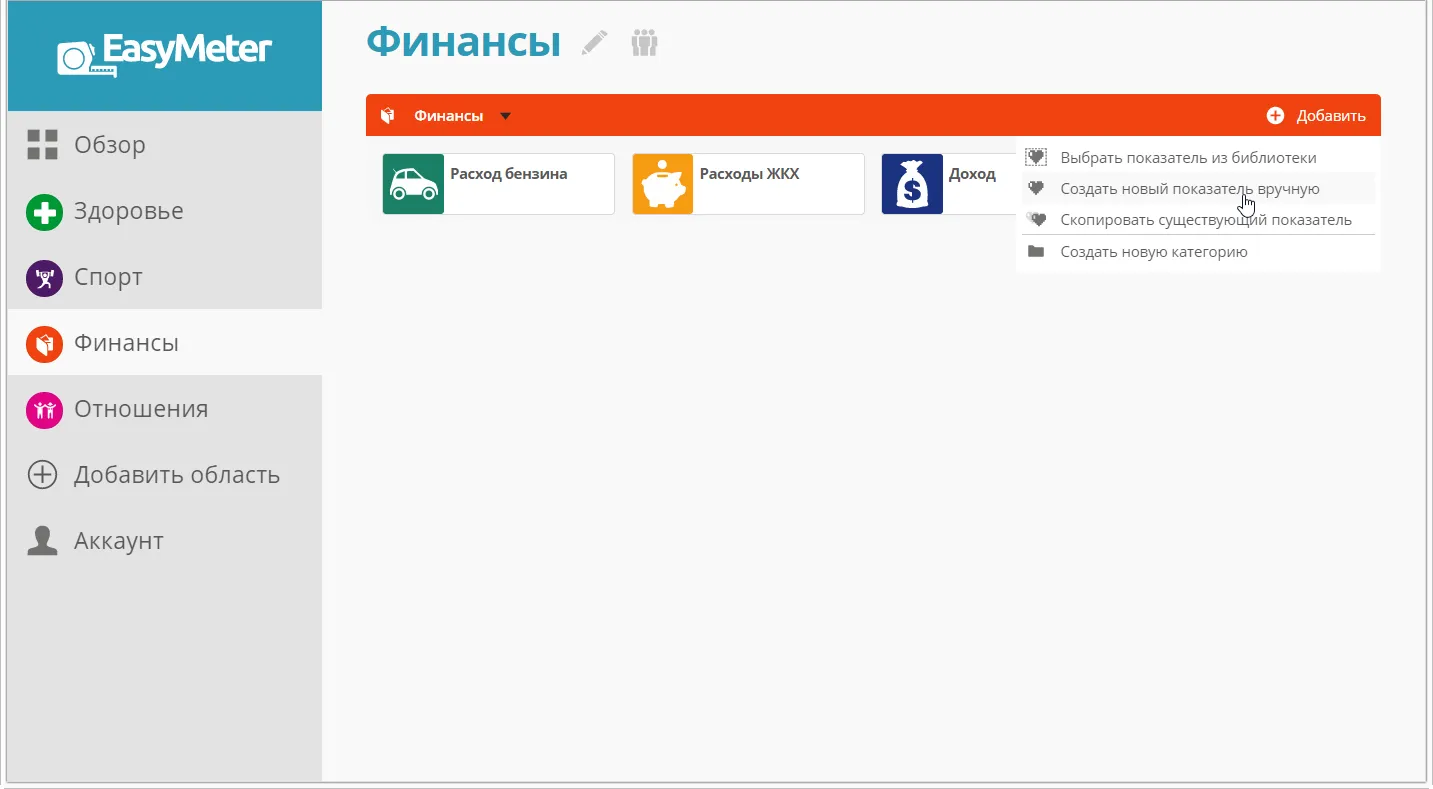
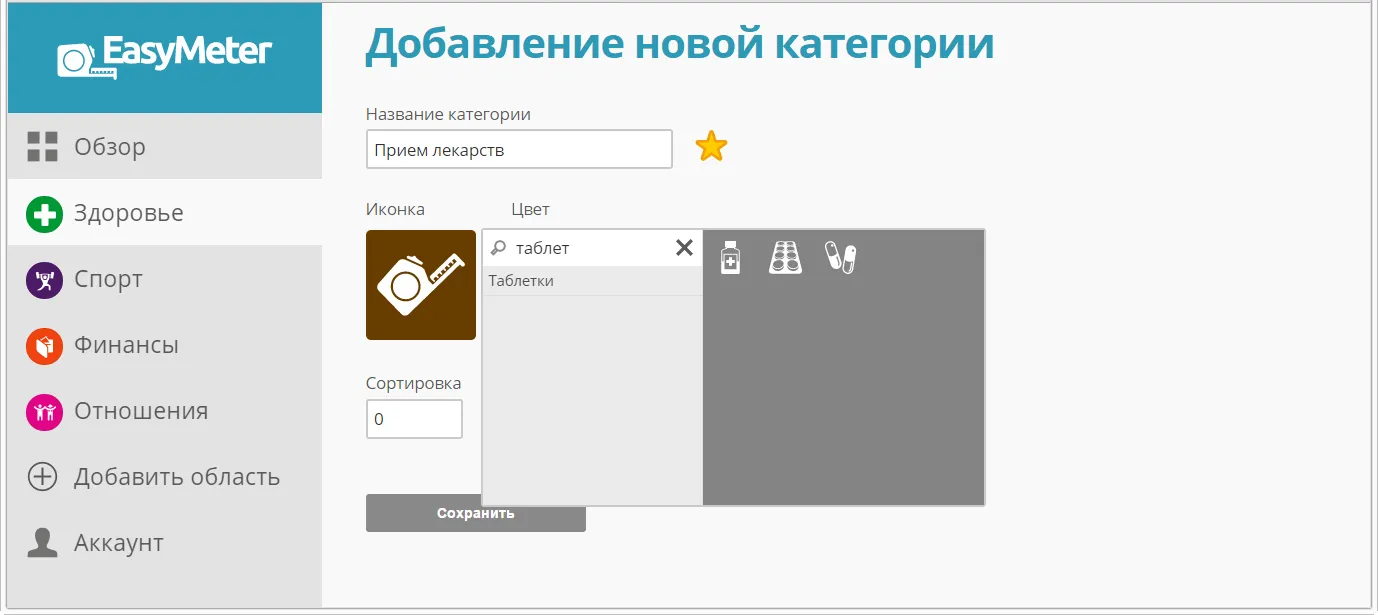
Metrics were grouped into categories with their own icons and colors. You could use the built-in ones or create your own. The "Add" button gave you four options: pick from a library of pre-made metrics, create one from scratch, clone an existing one, or add a new category.
What I learned
This was a classic side project that taught me a lot about building flexible data models. The challenge was making the system generic enough to track anything — from integers to booleans to free text — while still keeping the UI clean and intuitive. It never became a commercial hit, but I used it myself for months and it genuinely helped me see patterns I wouldn't have noticed otherwise.